Market Summary
In Q2 2024, capital market participants continued to sift through various economic indicators, looking for any signal that the Federal Reserve (the “Fed”) would begin to cut interest rates. The market’s yearning for rate cuts began in earnest in Q4 2023 and has driven outperformance in pockets of the market, where companies may benefit from a lower discount rate and borrowing costs. With the market this year, at one point pricing in upwards of seven rate cuts this year, the Fed funds rate remains at 5.25% – 5.50% following a series of rapid increases initiated in March 2022. The persistence of higher-for-longer inflation is the primary culprit for the lack of Fed action so far this year, as they cannot risk a reacceleration of inflation should they decide to cut rates too soon. While their stated inflation target is 2%, there still may be room for rate cuts if the long-term inflation rate settles around 3%, but not as much as more speculative investment vehicles that benefitted to a greater degree from near zero-percent interest rates during the 2010s are hoping for, and pricing in.
The narrow breadth and leadership of large-cap indexes continue to signal caution. As of this writing, six stocks comprise 31% of the S&P 500 and have accounted for about 65% of the index’s total return this year. There are some striking similarities to the “tech bubble” that peaked in early 2000, where the top ten stocks in the S&P 500 accounted for 27% of the index. The lack of breadth today is even more extreme. Interestingly, we note that Cisco’s 5-year annualized return of 105% from March 31, 1995, through March 31, 2000, is astonishingly like that of Nvidia’s 5-year total annualized return of 98% through June 30, 2024. As the tech bubble started to deflate late in 2000, Cisco would go on to fall (87%) over the next 30 months. This ushered in a difficult decade for growth stocks, where from 2000 to 2010, large-cap domestic growth stocks fell (33%) while other investments like bonds, small-cap stocks, and emerging markets outperformed.
While we don’t necessarily foresee a similar “crash” in technology stocks forthcoming, we question the impact that items such as the advent of passive investing and more quantitative-based trading models have had on the narrow breadth and leadership we currently see. These tools have led to higher correlations and lower dispersion in stocks with higher market capitalizations as broad-based flows move into and out of those names daily for little fundamental reason related to the specific group of stocks. Many investors in this investing style may have little idea of the concentration risk they are taking, especially given that the benefits of such styles are pitched as diversification and risk mitigation tools. When combined with historical Fed intervention over the last fifteen years, we are unsure if the long-term effects and reverberations have yet to be fully realized.
While the S&P 500 gained 4.3% in Q2 and 15.3% in the first half of the year, driven primarily by technology and AI narratives, we believe significant value can be found in large-cap stocks beyond the concentrated growth stories dominating headlines. The narrow breadth of market performance has created opportunities for bottom-up stock pickers to focus on large-cap value stocks that have been overlooked amid the rally in a handful of growth names. We can identify large-cap stocks trading below their intrinsic value by concentrating on companies with strong fundamentals, robust cash flows, and solid balance sheets. We believe this approach allows us to position our portfolio to benefit from market corrections or shifts in investor sentiment, ultimately driving long-term returns across varying market environments.
Performance Highlights
In Q2 2024, the Easterly Concentrated Large Cap Value strategy performed positively, outperforming the benchmark Russell 1000 Value Index. The portfolio’s relative performance was primarily driven by a strong selection effect, which offset a slightly negative allocation effect.
Information Technology significantly contributed to the portfolio’s positive performance at the sector level, with substantial returns driven by effective stock selection. The Industrials sector also contributed positively, benefiting from select holdings that outperformed their benchmarks. However, the Consumer Staples sector detracted from performance, with negative stock selection leading to underperformance relative to the benchmark. Health Care also faced challenges that contributed negatively to the portfolio.
Portfolio Attribution
Top 5 Performance Contributors
| Stock | Avg Weight % | Contribution % (net) |
|---|---|---|
| TAIWAN SEMICONDUCTOR-SP ADR | 3.17 | 0.84 |
| INTERNATIONAL FLAVORS & FRAGRANCES INC. | 3.13 | 0.51 |
| MICRON TECHNOLOGY INC. | 2.13 | 0.49 |
| ENCORE WIRE CORP. | 1.05 | 0.46 |
| INTERNATIONAL PAPER CO. | 1.20 | 0.40 |
Taiwan Semiconductor Manufacturing (TSM)
Taiwan Semiconductor Manufacturing Co. (TSM) had strong performance in Q2 2024, with a notable return of 28.16%, significantly outperforming the Information Technology sector’s return of -1.14%. This impressive growth was driven by TSM’s strong financial results, including a 59.6% year-over-year revenue surge in April 2024, reaching NT$236.02 billion, and a 9% rise in first-quarter net profit. Key drivers included robust demand for AI chips, bolstered by major clients such as Nvidia and Apple, and successful expansion efforts, like the upcoming $7.8 billion wafer plant in Singapore. TSM’s effective execution of its AI-focused strategy and continued innovation in advanced chip manufacturing contributed significantly to its stock’s stellar performance. This momentum reflects TSM’s strong positioning in a rapidly growing AI market. Given the increasing demand for AI chips and TSM’s leading role in this sector, the company is well-positioned for sustained revenue growth and market dominance, making it a compelling investment for the future.
International Flavors & Fragrances Inc. (IFF)
International Flavors & Fragrances Inc. (IFF) posted a strong return of 11.18% during the 2nd quarter of 2024, outperforming its sector, Materials. This performance was driven by better-than-expected earnings in Q1, with an EPS of $1.13, significantly surpassing the market consensus of $0.84. The company’s strategic focus on innovation and portfolio optimization, highlighted by completing the divestiture of its Cosmetic Ingredients business, contributed positively to its financial performance. Additionally, IFF’s robust margins, with an operating EBITDA margin of 19.9%, and its declared quarterly dividend further supported investor confidence. Despite challenging market conditions, IFF’s ability to deliver strong financial results and strategic execution underpinned its solid performance.
We have decided to exit our position in International Flavors & Fragrances Inc., recognizing its positive contribution to our portfolio. However, concerns regarding valuation and the sustainability of recent earnings growth in a volatile sector prompted us to take a cautious approach. We mitigate potential downside risk from market corrections or unforeseen operational challenges by locking in gains. This exit strategy allows us to capture the upside while reducing exposure to potential risks in the current economic environment.
Micron Technology Inc. (MU)
Micron Technology Inc. (MU) delivered an impressive stock return of 30.16% during the 2nd quarter of 2024, significantly outperforming the Information Technology sector. This performance was largely driven by a surge in demand for its memory chips, fueled by the booming artificial intelligence (AI) industry. Micron’s Q3 revenue rose to $6.81 billion, a substantial increase from $3.75 billion in the same quarter last year, benefiting from AI-related growth, particularly in data centers where revenue surged by 50%. Despite challenges, including a slight dip in stock prices after Q3 results due to in-line revenue guidance, the market’s optimism around Micron’s strategic positioning in AI-driven markets and strong financial results helped propel its stock. The company’s ability to consistently meet or exceed market expectations and significant AI-driven demand underscores the positive momentum.
We have decided to exit our position in Micron Technology Inc., acknowledging its strong contribution to our portfolio during this period. While the company has shown robust growth, particularly from AI-related demand, concerns over its valuation and in-line guidance that fell short of some market expectations led us to take a more cautious stance. Additionally, with the stock having appreciated significantly, we believe it is prudent to lock in gains at this stage.
Top 5 Performance Detractors
| Stock | Avg Weight % | Contribution % (net) |
|---|---|---|
| QUANTERIX CORP. | 1.82 | -0.83 |
| TARGET CORP | 3.83 | -0.64 |
| VIATRIS INC. | 5.63 | -0.53 |
| DOLLAR TREE INC. | 1.77 | -0.33 |
| DOW INC. | 4.64 | -0.30 |
Quanterix Corp. (QTRX)
Quanterix Corp. (QTRX) saw a significant decline of 43.93% during the Q2 2024, underperforming within the Healthcare sector. The primary driver behind this underperformance was the challenging capital environment, which led to a 52% drop in instrument revenue, a key component of the company’s business model. Additionally, despite a 13% increase in total revenue to $32.1 million, the company faced a net loss of $14.0 million, exacerbated by higher operating expenses that rose by $7.2 million year-over-year. The continued softness in capital expenditures and delays in adopting new assays further pressured the stock despite improvements in the consumables and Accelerator Lab segments.
While Quanterix faced a difficult quarter, we maintain our position based on the company’s strong underlying technology and long-term growth potential, particularly in the neurology diagnostics space. The ongoing development of innovative assays and the company’s strategic shift towards a more diversified revenue mix, including its Accelerator Lab services, position it well for future recovery. Furthermore, the stock’s current valuation and robust cash position of $304.5 million provides a cushion against near-term volatility. As Quanterix continues to lead in ultra-sensitive biomarker detection and expands its product offerings, we anticipate a potential turnaround in the coming quarters.
Target Corp (TGT)
Target Corp (TGT) underperformed in the 2nd quarter of 2024, with a stock decline of 15.88%, compared to its sector’s positive performance. This decline was driven primarily by disappointing first-quarter results, where comparable sales fell by 3.7%, and overall revenue dropped by 3.1% to $24.1 billion. Inflation and a pullback in consumer spending on discretionary items led to weaker-than-expected earnings, with net income falling to $942 million, or $2.03 per share. Target’s strategy to lower prices on 5,000 essential items in response to inflationary pressures did not significantly bolster sales, contributing to the stock’s decline as investors reacted to the cautious growth outlook provided by the company.
Despite the recent challenges, we maintain our position in Target Corp based on its solid market presence and strategic initiatives to drive long-term growth.
Viatris Inc. (VTRS)
Viatris Inc. (VTRS) underperformed in the 2nd quarter of 2024, with a stock decline of 9.96%, against broader sector underperformance. The company missed revenue and earnings estimates in Q1 2024, reporting total revenues of $3.66 billion and an adjusted EPS of $0.67, slightly below expectations. This was largely due to weaker sales of legacy products like Lipitor and Norvasc, which continue to face declining demand. Additionally, Viatris’ ongoing divestitures, including the sale of its women’s healthcare and OTC businesses, have created short-term revenue pressure, contributing to the stock’s decline during the quarter. Despite reaffirming its 2024 financial guidance, the market reacted negatively to the company’s performance and outlook.
We maintain our position in Viatris Inc., believing that the company’s strategic focus on innovation and expansion into new therapeutic areas will drive long-term value. The recent Oyster Point Pharma and Famy Life Sciences acquisitions and the launch of new products like Ryzumvi position Viatris to capture growth in the ophthalmology segment. The company’s commitment to returning capital to shareholders through dividends and share repurchases further supports its value proposition. We anticipate improved financial performance and stock recovery as Viatris continues to streamline its operations and reduce debt.
Source: SEI Global Services
Securities shown represent the highest contributors and detractors to the portfolio’s performance for the period and do not represent all holdings within the portfolio. There is no guarantee that such holdings currently or will remain in the portfolio. For a complete list of holdings and an explanation of the methodology employed to determine this information, please contact Easterly. This information is not to be construed as an offer to buy or sell any financial instrument nor does it constitute an offer or invitation to invest in any fund managed by Easterly and has not been prepared in connection with any such offer.
Trailing Performance
as of June 30, 2024
| QTD | YTD | 1 Yr | 3 Yr | 5 Yr | 7 Yr | 10 Yr | Since Inception* | |
|---|---|---|---|---|---|---|---|---|
| Composite (gross) | 0.38% | 13.1% | 21.61% | 7.54% | 10.56% | 8.83% | 9.85% | 9.36% |
| Composite (net) | 0.27% | 12.85% | 21.06% | 7.06% | 10.06% | 8.34% | 9.36% | 8.87% |
| Russell 1000 Value | -2.17% | 6.62% | 13.06% | 5.52% | 9.00% | 8.60% | 8.22% | 6.97% |
Calendar Year Performance
| 2023 | 2022 | 2021 | 2020 | 2019 | 2018 | 2017 | 2016 | 2015 | 2014 | |
|---|---|---|---|---|---|---|---|---|---|---|
| Composite (gross) | 11.20% | -3.13% | 23.72% | 8.07% | 14.44% | -8.18% | 14.62% | 19.18% | 2.72% | 13.30% |
| Composite (net) | 10.71% | -3.55% | 23.18% | 7.57% | 13.93% | -8.60% | 14.11% | 18.66% | 2.26% | 12.79% |
| Russell 1000 Value | 11.46% | -7.54% | 25.16% | 2.80% | 26.54% | -8.27% | 13.66% | 17.34% | -3.83% | 13.45% |
Source: SEI Global Services
*Inception: 1/1/2007
Performance shown is the Easterly Investment Partners LLC (“the Firm”) Large Cap Value composite in USD. Past performance is not indicative of future results. Gross performance results do not include advisory fees and other expenses an investor may incur, which when deducted will reduce returns. Changes in exchange rates may have adverse effects. Net performance results reflect the application of a model investment management fee which is higher than the actual average weighted management fee charged to accounts in the composite applied to gross performance results. Actual fees may vary depending on, among other things, the applicable fee schedule and portfolio size. The Firm claims compliance with the GIPS® standards; this information is supplemental to the GIPS® report included in this material. Returns greater than one year are annualized.
Top 10 Holdings
| VERIZON COMMUNICATIONS INC | 6.13% |
| VIATRIS INC | 5.87% |
| CISCO SYSTEMS INC | 5.00% |
| JOHNSON CONTROLS INTERNATIONAL | 4.88% |
| DOW INC | 4.69% |
| BANK OF AMERICA | 4.44% |
| TARGET CORP | 3.88% |
| TAIWAN SEMICONDUCTOR-SP ADR | 3.82% |
| EVERSOURCE ENERGY | 3.82% |
| QUANTERIX CORP. | 3.17% |
| Total | 45.69% |
|---|
Excludes cash and cash equivalents.
References to securities, transactions or holdings should not be considered a recommendation to purchase or sell a particular security and there is no assurance that, as of the date of publication, the securities remain in the portfolio. Additionally, it is noted that the securities or transactions referenced do not represent all of the securities purchased, sold or recommended during the period referenced and there is no guarantee as to the future profitability of the securities identified and discussed herein. Top ten holdings information shown combines share listings from the same issuer, and related depositary receipts, into a singular holding to accurately present aggregate economic interest in the referenced company.
Attribution vs Russell 1000 Value
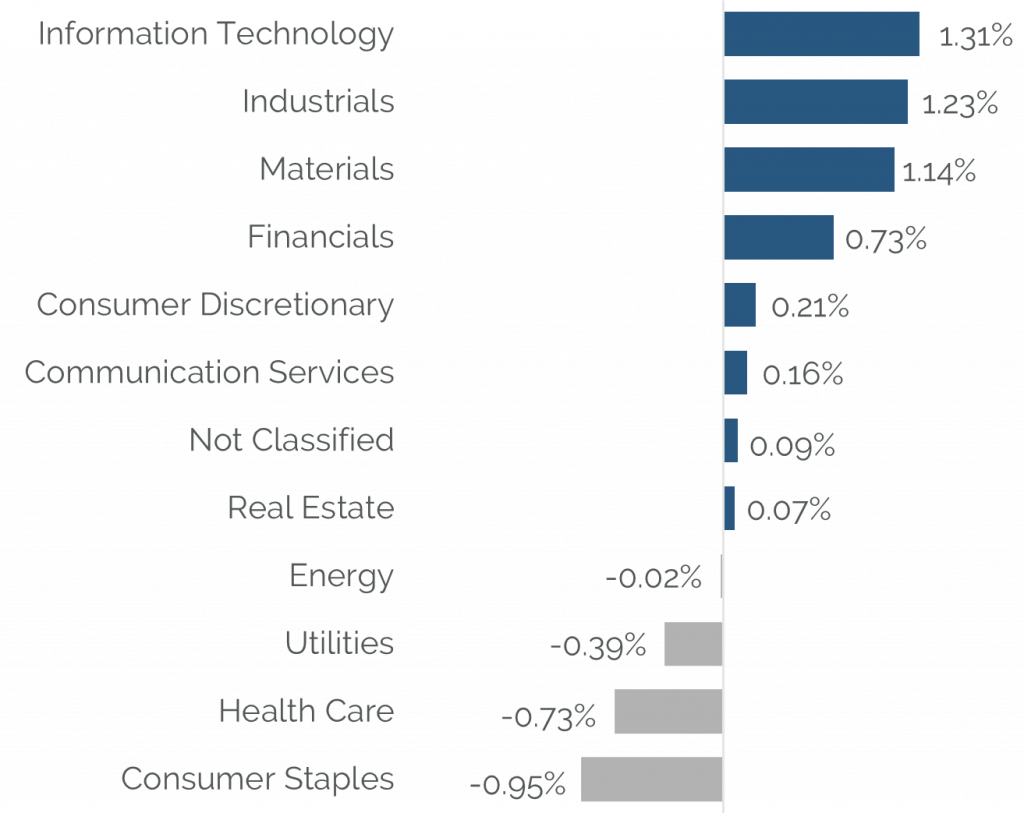
Source: Bloomberg
Holdings, sector weightings, market capitalization and portfolio characteristics are subject to change at any time and are based on a representative portfolio, and may differ, sometimes significantly, from individual client portfolios.
Outlook
The market continues to remain focused on the timing and magnitude of interest rate cuts from the Federal Reserve, which is looking more likely in the second half of the year even as they continue to reduce their balance sheet (which stands in contrast to their balance sheet expansion during the 2010s, artificially suppressing yields). While certain pockets of the small-cap market may outperform (stocks with negative earnings and/or high debt levels) as rate cuts are initially priced in, we question how sustainable that outperformance may remain as the market prices in a normalized Fed funds rate that may be higher than what those more speculative pockets of the market are hoping for.
As we work through a full US Presidential election cycle likely to bring volatility, items we’re paying heightened attention to include the US jobs market, where unemployment has increased above 4%. The jobs market has shown impressive resilience, while other cracks in the US economy have emerged over the last few quarters. Consumer spending, which is 70% of GDP, is declining as credit card balances continue to balloon higher. Retail sales are slowing and have turned negative when factoring in inflation. $1T in corporate debt annually continues to roll into issuances with much higher costs. We are unsure how this will impact more leveraged corporations, especially if cash flow falters. A housing market that looks increasingly unaffordable for many, especially younger people without familial financial assistance, may reshape how that younger cohort allocates their discretionary income. We are keeping a steady eye on the US fiscal deficit, the associated debt servicing costs, and the ramifications of legislators’ inability to rein in spending.
The Easterly Murphy team remains focused on allocating capital to companies experiencing short-term difficulties. We believe these companies have great balance sheets, material free cash flow, and a path to earnings recovery, resulting in asymmetric upside/downside return profiles.
Easterly Investment Partners LLC Large Cap Value Composite GIPS® Report
Composite Inception Date: January 1, 2007
Composite Creation Date: April 1, 2019
| Composite Performance | Annualized 3-Year Standard Deviation | Total Asset (millions) | |||||||||
|---|---|---|---|---|---|---|---|---|---|---|---|
| Year End | Gross | Net | Russell 1000® Value | Composite | Russell 1000® Value | Composite Dispersion | Total Firm Assets | Firm (AUM) | Firm (AUA)* | Composite AUM | Number of Accounts |
| 2023 | 11.20% | 10.71% | 11.46% | 16.89% | 16.74% | N/A | 1,730 | 1,090 | 640 | 250 | Five or fewer |
| 2022 | -3.13% | -3.55% | -7.54% | 24.41% | 21.55% | N/A | 1,834 | 1,341 | 493 | 449 | 6 |
| 2021 | 23.72% | 23.18% | 25.16% | 23.52% | 19.33% | 0.85% | 2,718 | 1,540 | 1,178 | 554 | 6 |
| 2020 | 8.07% | 7.57% | 2.80% | 23.83% | 19.90% | 0.80% | 2,192 | 599 | 1,593 | 509 | 6 |
| 2019 | 14.44% | 13.93% | 26.54% | 13.50% | 11.85% | 1.18% | 5,435 | 3,843 | 1,592 | 1,643 | 11 |
| 2018 | -8.18% | -8.60% | -8.27% | 11.54% | 10.82% | 0.37% | - | - | 2,079 | 18 | |
| 2017 | 14.62% | 14.11% | 13.66% | 11.80% | 10.20% | 0.31% | - | - | 3,198 | 22 | |
| 2016 | 19.18% | 18.66% | 17.34% | 12.29% | 10.77% | 0.40% | - | - | 3,105 | 21 | |
| 2015 | 2.72% | 2.26% | -3.83% | 11.37% | 10.68% | 0.28% | - | - | 2,900 | 22 | |
| 2014 | 13.30% | 12.79% | 13.45% | 10.27% | 9.20% | 0.33% | - | - | 3,178 | 23 | |
*Firm-wide advisory-only assets. Assets under Advisement (AUA) includes the assets where Easterly Investment Partners (“Easterly”) provides its advisory services in similar strategies and does not have discretionary trading authority.
Firm Definition
For purposes of complying with the GIPS® standards, the firm is defined as Easterly Investment Partners LLC (“EIP”) which is an SEC registered investment adviser under the U.S. Investment Advisers Act of 1940, as amended, effective January 2019. The firm was redefined on 1/1/2023 to reflect that EIP is comprised of two distinct firms: the institutional asset management operations, investment strategies, performance track records, certain employees and client accounts of Levin Capital Strategies, which were acquired by EIP in March 2019, and Snow Capital Management LLC’s (“SCM”) asset management business, investment strategies, performance track records, client accounts, and certain employees, acquired by EIP in July 2021.
Firm Verification Statement
Easterly claims compliance with the Global Investment Performance Standards (GIPS®) and has prepared and presented this report in compliance with the GIPS standards. Easterly has been independently verified for the period April 1, 2019 through December 31, 2023. A firm that claims compliance with the GIPS standards must establish policies and procedures for complying with all the applicable requirements of the GIPS standards. Verification provides assurance on whether the firm’s policies and procedures related to composite and pooled fund maintenance, as well as the calculation, presentation, and distribution of performance, have been designed in compliance with the GIPS standards and have been implemented on a firm-wide basis.
Composite Verification Statement
The Large Cap Value Composite has had a performance examination from composite inception date through December 31, 2023. The verification and performance examination reports are available upon request.
Composite Description
The Large Cap Value composite provides exposure to long-only US public equities and ADRs, with occasional investments in convertible and corporate bonds. The strategy is biased toward large capitalization value stocks, and typically maintains between 30 and 40 positions, but may be more or less concentrated during various periods.
Benchmark Description
The Russell 1000® Value Total Return Index measures the performance of the large-cap value segment of the U.S. equity universe. It includes those Russell 1000® Index companies with lower price-to-book ratios and lower expected growth values. The total return index is the price level index plus the dividend reinvested. Indexes are unmanaged. It is not possible to invest directly in an index.
The S&P 500 Index was retroactively removed as of 10/1/2022
Performance Calculation
All returns are calculated and presented in US dollars based on fully discretionary AUM, including those investors no longer with the firm. All gross composite returns are net of transaction costs and foreign withholding taxes, if any, and reflect the reinvestment of interest income and other earnings. Net performance results reflect the application of a model investment management fee which is higher than the actual average weighted management fee charged to accounts in the composite applied to gross performance results. Composite net returns are calculated by reducing the daily gross return by 1/12th of the highest advisory fee rate on day prior to month end (same day fees are booked), then linked with the daily returns to create the Monthly net return. Monthly net returns are then geometrically linked to calculate the annual net return. Actual fees may vary depending on, among other things, the applicable fee schedule and portfolio size. Actual investment advisory fees incurred by clients will vary. Policies for valuing investments, calculating performance, and preparing GIPS reports are available upon request. A list of composite descriptions and a list of broad distribution pooled funds are available upon request. Past performance is not indicative of future performance. Results may be higher or lower based on IPO eligibility, and actual investor’s returns may differ, depending upon date(s) of investment(s). Additional information is available upon request.
Investment Management Fee Schedule
The current standard management fee schedule for a segregated account managed to the composite strategy is as follows: 0.45% on assets.
Composite Dispersion
The annual composite dispersion, if shown, is an asset-weighted standard deviation calculated using gross returns for the accounts in the composite the entire year. The internal dispersion measure is not applicable if there are five or fewer portfolios in the composite for the entire year if that is the reason this is N/A.
Standard Deviation
The annualized 3-year standard deviation represents the annualized standard deviation of actual gross composite and benchmark returns, using the rolling 36 months ended each year end. Standard deviation is a measurement of historical volatility of investment returns.
Trademark
GIPS® is a registered trademark of CFA Institute. CFA Institute does not endorse or promote this organization, nor does it warrant the accuracy or quality of the content contained herein.
Important Disclosures
© 2024. Easterly Asset Management. All rights reserved.
Easterly Asset Management’s advisory affiliates (collectively, “EAM” or “the Firm”), including Easterly Investment Partners LLC, Easterly Funds LLC, and Easterly EAB Risk Solutions LLC (“Easterly EAB”) are registered with the SEC as investment advisers under the Investment Advisers Act of 1940, as amended. Registration does not imply a certain level of skill or training. More information about the firm, including its investment strategies and objectives, can be found in each affiliate’s Form ADV Part 2 which is available on the www.sec.gov website. This information has been prepared solely for the use of the intended recipients; it may not be reproduced or disseminated, in whole or in part, without the prior written consent of EAM.
No funds or investment services described herein are offered or will be sold in any jurisdiction in which such an offer or sale would be unlawful under the laws of such jurisdiction. No such fund or service is offered or will be sold in any jurisdiction in which registration, licensing, qualification, filing or notification would be required unless such registration, license, qualification, filing, or notification has been affected.
The material contains information regarding the investment approach described herein and is not a complete description of the investment objectives, risks, policies, guidelines or portfolio management and research that supports this investment approach. Any decision to engage the Firm should be based upon a review of the terms of the prospectus, offering documents or investment management agreement, as applicable, and the specific investment objectives, policies and guidelines that apply under the terms of such agreement. There is no guarantee investment objectives will be met. The investment process may change over time. The characteristics set forth are intended as a general illustration of some of the criteria the strategy team considers in selecting securities for client portfolios. Client portfolios are managed according to mutually agreed upon investment guidelines. No investment strategy or risk management techniques can guarantee returns or eliminate risk in any market environment. All information in this communication has been obtained from sources believed to be reliable but cannot be guaranteed. Investment products are not FDIC insured and may lose value.
Investments are subject to market risk, including the loss of principal. Nothing in this material constitutes investment, legal, accounting or tax advice, or a representation that any investment or strategy is suitable or appropriate. The information contained herein does not consider any investor’s investment objectives, particular needs, or financial situation and the investment strategies described may not be suitable for all investors. Individual investment decisions should be discussed with a personal financial advisor. Any opinions, projections and estimates constitute the judgment of the portfolio managers as of the date of this material, may not align with the Firm’s opinion or trading strategies, and may differ from other research analysts’ opinions and investment outlook. The information herein is subject to change without notice and may be superseded by subsequent market events or for other reasons. EAM assumes no obligation to update the information herein. References to securities, transactions or holdings should not be considered a recommendation to purchase or sell a particular security and there is no assurance that, as of the date of publication, the securities remain in the portfolio. Additionally, it is noted that the securities or transactions referenced do not represent all of the securities purchased, sold or recommended during the period referenced and there is no guarantee as to the future profitability of the securities identified and discussed herein. As a reminder, investment return and principal value will fluctuate. The indices cited are, generally, widely accepted benchmarks for investment performance within their relevant regions, sectors or asset classes, and represent non managed investment portfolio. It is not possible to invest directly in an index.
Any opinions, projections and estimates constitute the judgment of the portfolio managers as of the date of this material, may not align with the Firm’s opinion or trading strategies, and may differ from other research analysts’ opinions and investment outlook. The information herein is subject to change without notice and may be superseded by subsequent market events or for other reasons. EAM assumes no obligation to update the information herein.
This communication may contain forward-looking statements, which reflect the views of EAM and/or its affiliates. These forward-looking statements can be identified by reference to words such as “believe”, “expect”, “potential”, “continue”, “may”, “will”, “should”, “seek”, “approximately”, “predict”, “intend”, “plan”, “estimate”, “anticipate” or other comparable words. These forward-looking statements or other predications or assumptions are subject to various risks, uncertainties, and assumptions. Accordingly, there are or will be important factors that could cause actual outcomes or results to differ materially from those indicated in these statements. Should any assumptions underlying the forward-looking statements contained herein prove to be incorrect, the actual outcome or results may differ materially from outcomes or results projected in these statements. EAM does not undertake any obligation to update or review any forward-looking statement, whether as a result of new information, future developments or otherwise, except as required by applicable law or regulation.
Past performance is no guarantee of future results.
20240819-3797856