Market Summary
The U.S. economy exhibited resilience in the first quarter of 2024, exceeding expectations and contributing to signs of global economic stabilization. Reported inflation figures declined from 9% to 3% on a year-over-year basis, in part due to the Fed’s series of rate hikes that brought the Fed Funds rate from 0.25% to 5.50% in about fifteen months. While inflation has come down on a rate-of-change basis, it remains structurally high as the market focuses on inflation’s directionality and subsequent Federal Reserve monetary policy decisions.
The Fed’s implied transition to an easing stance after rapid tightening has notably relaxed financial conditions and boosted investor confidence, particularly revitalizing cyclical sectors through the second half of 2023 and into 2024. Large cap stocks outperformed during Q1 on these rate cut expectations, while our view is that stubbornly high inflation will make it difficult to cut rates in the near-term despite any political pressure the Fed may be feeling during an election cycle. Inflation remains high globally, not just here in the U.S. The Fed’s balance sheet expanded from $1 trillion to $9 trillion during the zero-interest-rate environment of the 2010s and through the Covid-19 pandemic, and while they have reduced it to about $7.5 trillion today, we cannot ignore the contrast between what the equity market is yearning for (rate cuts) and what the Federal Reserve is doing (reducing their balance sheet by up to $95B per month). In reducing its balance sheet, the Fed can either allow securities to mature or in some instances sell securities back into the market. Neither situation is conducive to moving toward a lower interest rate environment relative to when the Fed was actively purchasing these securities, artificially driving yields lower. While the Fed has publicly signaled that they may be done shrinking their balance sheet soon, and they don’t expect a return to a sub-$4 trillion balance sheet, it is unrealistic to expect them to become an active purchaser once again in the near-term given the inflation backdrop. This is an area the market does not seem to be focused on as it searches for clues concerning the timing of when the Fed will begin to cut interest rates.
Despite certain positive signs such as strong reported jobs figures and a low unemployment rate, concerns linger, and cracks are showing amidst an otherwise optimistic 2024 economic outlook. Consumer behavior remains a critical economic driver, with broad wage gains supporting spending despite increasing inflation pressures. Notably, there’s a growing reliance on credit, particularly among lower-income households, with credit card debt reaching greater than $1.1 trillion, an all-time-high. Spending patterns are changing with younger demographics choosing to spend more freely on discretionary items as they view the concept of home ownership unrealistic for them in the near future. The rising delinquency rates in various debt types, excluding student loans, underscore emerging financial stresses as non-mortgage debt interest payments now parallel mortgage interest burdens.
We are also watching corporate debt levels closely, as more highly levered companies who had access to cheap debt are now finding themselves having to roll that debt at much higher (and costly) rates. Rate cuts don’t bail out companies in this situation either, given we are not returning to near 0% rates of the 2010s. We also question the impact of higher rates on exploding federal deficits. With an annual deficit of more than $2T, as a percentage of GDP (about 8%) the deficit is larger than any fiscal year in history where the country did not face a war, recession or other major emergency. The path to fiscal deficit reduction looks arduous given congressional polarization. Simultaneously, interest payments on the fiscal debt was up nearly 40% in 2023 to about $660B and will only continue to rapidly accumulate. How these deficits will reverberate through the general economy remains to be seen.
U.S. equities experienced a robust Q1 2024, with the S&P 500 achieving a 10.2% gain and surpassing the 5,200 mark for the first time. This performance builds on the momentum from 2023, with back-to-back quarterly gains yielding a cumulative increase of 22.5%. The quarter’s strong equity performance was underpinned by resilient job creation, solid wage growth, and consumer spending, alongside better-than-expected corporate earnings.
S&P 500 companies surpassed earnings expectations by 4% for Q4 2023, with projections indicating a 12% earnings growth in 2024. Historical data suggests a favorable outlook when equities exhibit such growth patterns, although we question if investors will continue to be willing to pay a historically high 20x earnings for the narrow breadth of the S&P 500 where the “Magnificent 7” constitute 28% of the index.
Sector-wise, Communication Services, Energy, and Information Technology led the market, with Financials and Industrials also outperforming the broader index. Over 80% of S&P 500 constituents were above their 200-day moving average by the end of Q1, signaling broad market strength. Small-caps, although trailing behind large-caps, are poised for potential growth, especially with the Russell 2000 expected to see larger earnings growth rebound compared to the S&P 500.
Performance Highlights
The strategy outperformed the Russell 3000 Value benchmark by 166 basis points, driven largely by a strong stock selection effect, despite a slight drag from allocation. Overall, the portfolio’s total return exceeded the benchmark, affirming the effectiveness of the selected investment strategy, particularly in stock picking.
Sector-wise, notable contributions came from Communication Services and Consumer Staples, which benefited significantly from favorable stock selection, overshadowing minimal allocation impacts. Information Technology also added positively through selection, even though its substantial weight over the benchmark slightly hurt performance due to weaker sector returns. On the downside, Health Care and Industrials detracted from overall performance due to adverse selection effects and negative returns, exacerbated by their respective weights compared to the benchmark. The allocation to cash, reflecting a cautious stance, had a negative impact on the portfolio during this period due to the strong market environment.
Source: SEI Global Services
Securities shown represent the largest contributors and detractors to the portfolio’s performance for the period and do not represent all holdings within the portfolio. There is no guarantee that such holdings are currently or will remain in the portfolio. For a complete list of holdings and an explanation of the methodology employed to determine this information, please contact Easterly. This information is not to be construed as an offer to buy or sell any financial instrument nor does it constitute an offer or invitation to invest in any fund managed by Easterly and has not been prepared in connection with any such offer.
Portfolio Attribution
Top 5 Performance Contributors
| Stock | Avg Weight % | Contribution % |
|---|---|---|
| SUPER MICRO COMPUTER INC | 1.39 | 1.90 |
| WALT DISNEY CO/THE | 3.13 | 1.01 |
| PILGRIM'S PRIDE CORP | 3.84 | 0.88 |
| SILICON MOTION TECHNOL-ADR | 3.19 | 0.79 |
| JPMORGAN CHASE & CO | 4.19 | 0.75 |
Super Micro Computer Inc. (SMCI)
Super Micro Computer Inc. (SMCI) showed remarkable performance in the first quarter of 2024, with a stock return of 255.3%, vastly outperforming the Information Technology sector. The company’s revenue surged to $3.66 billion, 30% above initial guidance, and surpassed all of 2021 revenues. SMCI’s explosive growth over the last year relates to the aggressive push in AI infrastructure development which the company’s products are highly efficient and quick to market. Strategic developments, such as the expansion of the Malaysia facility and a strong market response to the company’s S&P 500 inclusion, contributed to the stock’s momentum in the quarter. We continue to hold shares of SMCI as the company’s backlog growth and margin expansion opportunities remain compelling, though we have reduced our position as shares have surged.
Walt Disney (DIS)
The Walt Disney Company (DIS) was sold from the Focused Value portfolio during the quarter due to a disappointing trajectory of the company’s Entertainment segment, which has degraded companywide free-cash-flow with an uncertain path to recovery. Given the concentrated nature of the portfolio, capital was rotated into ideas with better near-term catalyst and risk/reward profiles.
Pilgrim’s Pride Corp (PPC)
Pilgrim’s Pride Corp (PPC) demonstrated a strong first quarter in 2024, significantly outperforming the Consumer Staples sector. The company reported an EPS of $0.59 on total revenue of $4.53 billion, exceeding expectations due to robust performances in the U.S. and Europe. Noteworthy developments included a rise in U.S. revenue by 9.5% year-over-year and improved operational margins in Europe, attributed to strategic plant network consolidation and positive pricing dynamics. PPC’s adept handling of supply chain efficiencies and favorable commodity pricing, particularly in corn and soybean stocks, bolstered its financial standing. The company’s forward-looking strategies and operational agility are evident in these results, fostering investor confidence.
Top 5 Performance Detractors
| Stock | Avg Weight % | Contribution % |
|---|---|---|
| INTEGRA LIFESCIENCES HOLDING | 2.73 | -0.59 |
| AMN HEALTHCARE SERVICES INC | 1.42 | -0.58 |
| INTEL CORP | 2.99 | -0.43 |
| OPEN TEXT CORP | 3.61 | -0.28 |
| PHOTRONICS INC | 1.97 | -0.21 |
Integra LifeSciences Holdings (IART)
Integra LifeSciences Holdings (IART) faced a notable underperformance in the quarter, with its EPS of $0.83 on total revenue of $397 million falling short of expectations. Gross Margin decreased to 64.7%, affected by supply constraints in the Skin business and the Boston manufacturing facility’s downtime. The company’s EBITDA margin also declined to 25.3%. The guidance for FY 2024 indicates a cautious outlook, with projected revenue and EPS below previous expectations, largely due to ongoing challenges in product supply and the gradual reintegration of the Boston facility’s portfolio. The stock remains cheap on a P/E basis with stable, growing end markets and a path towards higher normalized EPS.
AMN Healthcare Services Inc. (AMN)
AMN Healthcare Services Inc. shares underperformed this quarter, with shares falling by approximately 17%. Despite reporting better-than-expected fourth-quarter results with adjusted EPS of $1.32 and revenues of $818 million, the company’s first-quarter guidance for 2024 fell short of expectations due to a continued downturn in travel nurse assignments. Bill rates, while stable, are impacted by weaker-than-expected winter order volumes. AMN Healthcare’s recent performance reflects ongoing sector-specific challenges, particularly in its travel nurse and allied staffing segments. 2023 was a challenging year as hospital systems continued to reduce temporary labor faster than expected. AMN’s proactive strategies and recent growth of the backlog indicate potential for recovery in the latter half of 2024. AMN’s recent track record of lowering guidance has negatively impacted sentiment, though we believe the strong cash flow generation and balance sheet support shares during near-term uncertainty.
Intel Corp (INTC)
During the first quarter of 2024, Intel Corporation (INTC) underperformed, contrasting the gain of the broader Information Technology sector and following material outperformance in 2023. This underperformance can be attributed to several factors, including geopolitical tensions and market challenges. Notably, investors are concerned about China’s decision to exclude Intel’s processors from government computers, potentially impacting revenue. Additionally, Intel faced operational hurdles, as indicated by the delayed construction of its Ohio plant due to difficult operating conditions. Despite receiving substantial federal support through the CHIPS Act, amounting to nearly $20 billion in grants and loans aimed at enhancing U.S. chip production, these positive developments were overshadowed by immediate market and geopolitical challenges.
Trailing Performance
as of March 31, 2024
| QTD | YTD | 1 Yr | 3 Yr | 5 Yr | 7 Yr | 10 Yr | Since Inception* | |
|---|---|---|---|---|---|---|---|---|
| Composite (gross) | 10.47% | 10.47% | 29.21% | 9.14% | 13.90% | 10.32% | 7.90% | 9.83% |
| Composite (net) | 10.28% | 10.28% | 28.31% | 8.38% | 13.11% | 9.56% | 7.15% | 9.07% |
| Russell 3000 Value | 8.62% | 8.62% | 20.18% | 7.73% | 10.17% | 8.98% | 8.85% | 7.32% |
Calendar Year Performance
| 2023 | 2022 | 2021 | 2020 | 2019 | 2018 | 2017 | 2016 | 2015 | 2014 | |
|---|---|---|---|---|---|---|---|---|---|---|
| Composite (gross) | 16.08% | -5.75% | 28.03% | 10.25% | 26.52% | -18.39% | 14.46% | 16.73% | -12.36% | 8.17% |
| Composite (net) | 15.27% | -6.40% | 27.15% | 9.48% | 25.66% | -18.97% | 13.67% | 15.93% | -12.98% | 7.42% |
| Russell 3000 Value | 11.66% | -7.98% | 25.37% | 2.87% | 26.26% | -8.58% | 13.19% | 18.40% | -4.13% | 12.70% |
Source: SEI Global Services as March 31, 2024
*Inception: 4/1/1998
Performance shown is the Easterly Investment Partners LLC (“the Firm”) Snow All Cap Value composite in USD. Past performance is not indicative of future results. Gross performance results do not include advisory fees and other expenses an investor may incur, which when deducted will reduce returns. Changes in exchange rates may have adverse effects. Net performance results reflect the application of a model investment management fee which is higher than the actual average weighted management fee charged to accounts in the composite applied to gross performance results. Actual fees may vary depending on, among other things, the applicable fee schedule and portfolio size. The Firm claims compliance with the GIPS® standards; this information is supplemental to the GIPS® report included in this material. Returns greater than one year are annualized.
Top 10 Holdings
| JPMORGAN CHASE & CO | 4.36% |
| PILGRIM'S PRIDE CORP | 4.04% |
| LINCOLN NATIONAL CORP | 4.00% |
| COMMERCIAL METALS CO | 3.52% |
| WALT DISNEY CO/THE | 3.45% |
| METLIFE INC | 3.39% |
| SILICON MOTION TECHNOL-ADR | 3.38% |
| AMGEN INC | 3.25% |
| OPEN TEXT CORP | 3.24% |
| BLOOMIN' BRANDS INC | 3.19% |
| Total | 35.82% |
|---|
Excludes cash and cash equivalents.
References to securities, transactions or holdings should not be considered a recommendation to purchase or sell a particular security and there is no assurance that, as of the date of publication, the securities remain in the portfolio. Additionally, it is noted that the securities or transactions referenced do not represent all of the securities purchased, sold or recommended during the period referenced and there is no guarantee as to the future profitability of the securities identified and discussed herein. Top ten holdings information shown combines share listings from the same issuer, and related depositary receipts, into a singular holding to accurately present aggregate economic interest in the referenced company.
Attribution vs Russell 3000 Value
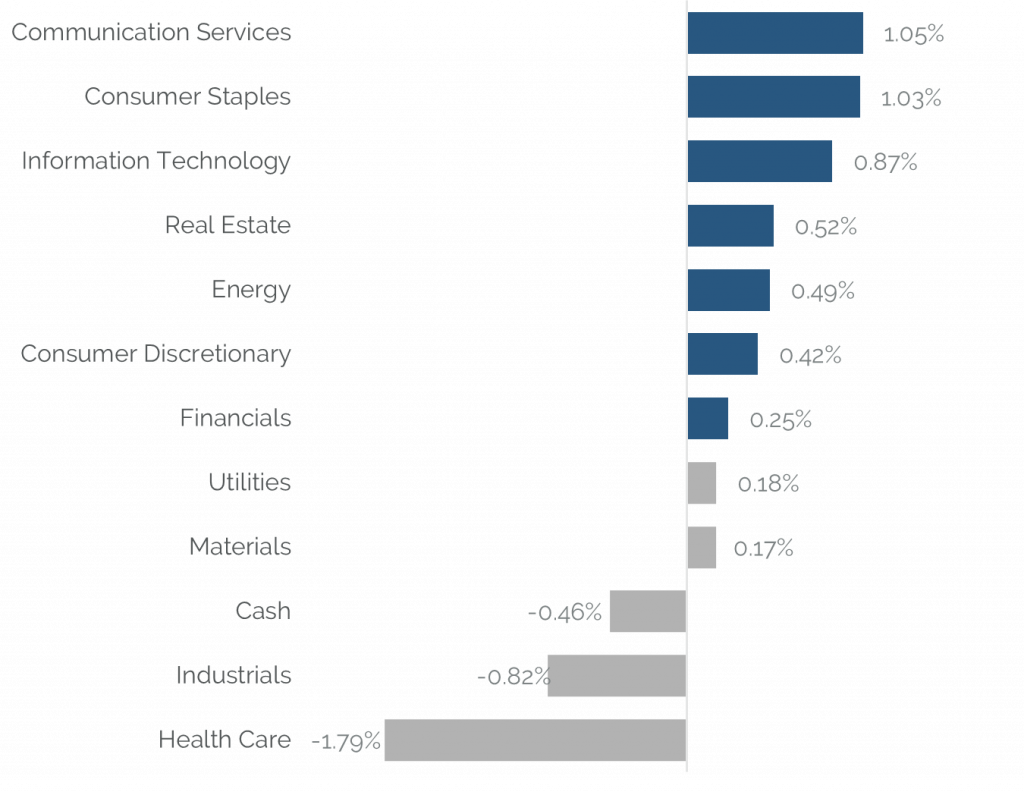
Source: Bloomberg
Holdings, sector weightings, market capitalization and portfolio characteristics are subject to change at any time and are based on a representative portfolio, and may differ, sometimes significantly, from individual client portfolios.
Outlook
Looking ahead for the rest of 2024, the Easterly Snow All Cap Value strategy remains strategically positioned to navigate the complexities of the economic landscape. While we expect volatility in 2024 given monetary policy uncertainty, a full U.S. election cycle, and ongoing geopolitical instability as just a few of the potential overhangs, as active managers we look forward to opportunities to find and populate our portfolio with stocks where the share price is trading at levels disconnected from underlying fundamentals. The emphasis on value stocks offers a robust value proposition, especially if the Federal Reserve’s actions deviate from the anticipated rate cuts, which could adversely affect high-valuation mega-cap stocks where a higher-for-longer discount rate is applied to their future cash flows.
The strategy’s approach, grounded in fundamental analysis and active management, is designed to deliver consistent performance, balancing the pursuit of alpha with robust risk mitigation strategies. The strategy continues to seek out companies with idiosyncratic, stock-specific catalysts that drive excess returns over full market cycles. Our investment team are no strangers to successfully navigating volatility over full market cycles as our core philosophy and process has been in place for over 30 years with little to no style drift. In closing, we remain dedicated to delivering strong long-term performance and transparent communications to our investors. Thank you for your confidence and commitment in Easterly Investment Partners. As always, we welcome your comments and questions.
Easterly Investment Partners LLC Snow All Cap Value Composite GIPS® Report
Composite Inception Date: April 1, 1998
Composite Creation Date: 07/01/2021
| Composite Performance | Annualized 3-Year Standard Deviation | Total Asset (millions) | |||||||||
|---|---|---|---|---|---|---|---|---|---|---|---|
| Year End | Gross | Net | Russell 1000® Value | Composite | Russell 1000® Value | Composite Dispersion | Total Firm Assets | Firm (AUM) | Firm (AUA)* | Composite AUM | Number of Accounts |
| 2023 | 16.08% | 15.27% | 11.66% | 18.68% | 16.92% | 0.20% | 1,730 | 1,090 | 640 | 16 | 14 |
| 2022 | -5.75% | -6.40% | -7.98% | 25.15% | 21.84% | 0.39% | 1,834 | 1,341 | 493 | 24 | 21 |
| 2021 | 28.03% | 27.15% | 25.37% | 23.74% | 19.61% | 0.47% | 2718 | 1540 | 1178 | 29 | 22 |
| 2020 | 10.25% | 9.48% | 2.87% | 24.08% | 19.96% | 0.60% | - | - | 23 | 20 | |
| 2019 | 26.52% | 25.66% | 26.26% | 15.90% | 12.00% | 0.40% | - | - | 35 | 27 | |
| 2018 | -18.39% | -18.97% | -8.58% | 15.00% | 11.00% | 0.20% | - | - | 745 | 33 | |
| 2017 | 14.46% | 13.67% | 13.19% | 14.40% | 10.30% | 0.30% | - | - | 265 | 63 | |
| 2016 | 16.73% | 15.93% | 18.40% | 14.80% | 11.00% | 0.40% | - | - | 732 | 88 | |
| 2015 | -12.36% | -12.98% | -4.13% | 13.60% | 10.70% | 0.60% | - | - | 668 | 100 | |
| 2014 | 8.17% | 7.42% | 12.70% | 13.20% | 9.40% | 0.50% | - | - | 841 | 118 | |
*Firm-wide advisory-only assets. Assets under Advisement (AUA) includes the assets where Easterly Investment Partners (“Easterly”) provides its advisory services in similar strategies and does not have discretionary trading authority.
Firm Definition
For purposes of complying with the GIPS® standards, the firm is defined as Easterly Investment Partners LLC (“EIP”) which is an SEC registered investment adviser under the U.S. Investment Advisers Act of 1940, as amended, effective January 2019. The firm was redefined on 1/1/2023 to reflect that EIP is comprised of two distinct firms: the institutional asset management operations, investment strategies, performance track records, certain employees and client accounts of Levin Capital Strategies, which were acquired by EIP in March 2019, and Snow Capital Management LLC’s (“SCM”) asset management business, investment strategies, performance track records, client accounts, and certain employees, acquired by EIP in July 2021.
Firm Verification Statement
Easterly claims compliance with the Global Investment Performance Standards (GIPS®) and has prepared and presented this report in compliance with the GIPS standards. Easterly has been independently verified for the period April 1, 2019 through December 31, 2023. A firm that claims compliance with the GIPS standards must establish policies and procedures for complying with all the applicable requirements of the GIPS standards. Verification provides assurance on whether the firm’s policies and procedures related to composite and pooled fund maintenance, as well as the calculation, presentation, and distribution of performance, have been designed in compliance with the GIPS standards and have been implemented on a firm-wide basis.
Composite Verification Statement
The All Cap Value Composite has had a performance examination from composite inception date through December 31, 2023. The verification and performance examination reports are available upon request.
Composite Description
The All Cap Value composite provides exposure to long-only US publicly-traded equities, allocating capital based on the attractiveness of each asset class. The fully invested portfolio typically maintains 35 to 40 positions. No stock is allowed to exceed 10% of the portfolio’s market value and no industry can exceed 25%.
Benchmark Description
The Russell 3000® Value Total Return Index is composed of 3000 large U.S. companies, as determined by market capitalization. This portfolio of securities represents approximately 98% of the investable U.S. equity market. The Russell 3000® is comprised of stocks within the Russell 1000® and the Russell 2000® indices.The total return index is the price level index plus the dividend reinvested. Indexes are unmanaged. It is not possible to invest directly in an index.
The S&P 500 Index was retroactively removed as of 10/1/2022
Performance Calculation
All returns are calculated and presented in US dollars based on fully discretionary AUM, including those investors no longer with the firm. All gross composite returns are net of transaction costs and foreign withholding taxes, if any, and reflect the reinvestment of interest income and other earnings. Net performance results reflect the application of a model investment management fee which is higher than the actual average weighted management fee charged to accounts in the composite applied to gross performance results. Composite net returns are calculated by reducing daily gross returns by an amount where the monthly net return will be the monthly gross return reduced by 1/12th of the highest advisory fee rate. Monthly net returns are then geometrically linked to calculate the annual net return. Actual fees may vary depending on, among other things, the applicable fee schedule and portfolio size. Actual investment advisory fees incurred by clients will vary. Policies for valuing investments, calculating performance, and preparing GIPS reports are available upon request. A list of composite descriptions and a list of broad distribution pooled funds are available upon request. Past performance is not indicative of future performance. Results may be higher or lower based on IPO eligibility, and actual investor’s returns may differ, depending upon date(s) of investment(s). Additional information is available upon request. The All Cap Value Composite has removes accounts from the composite for the period of significant cash flow of greater than or equal to $20 million.
Investment Management Fee Schedule
The current standard management fee schedule for a segregated account managed to the composite strategy is as follows: 0.70% on assets.
Composite Dispersion
The annual composite dispersion, if shown, is an asset-weighted standard deviation calculated using gross returns for the accounts in the composite the entire year. The internal dispersion measure is not applicable if there are five or fewer portfolios in the composite for the entire year if that is the reason this is N/A.
Standard Deviation
The annualized 3-year standard deviation represents the annualized standard deviation of actual gross composite and benchmark returns, using the rolling 36 months ended each year end. Standard deviation is a measurement of historical volatility of investment returns.
Trademark
GIPS® is a registered trademark of CFA Institute. CFA Institute does not endorse or promote this organization, nor does it warrant the accuracy or quality of the content contained herein.
Important Disclosures
© 2024. Easterly Asset Management. All rights reserved.
Easterly Asset Management’s advisory affiliates (collectively, “EAM” or “the Firm”), including Easterly Investment Partners LLC, Easterly Funds LLC, and Easterly EAB Risk Solutions LLC (“Easterly EAB”) are registered with the SEC as investment advisers under the Investment Advisers Act of 1940, as amended. Registration does not imply a certain level of skill or training. More information about the firm, including its investment strategies and objectives, can be found in each affiliate’s Form ADV Part 2 which is available on the www.sec.gov website. This information has been prepared solely for the use of the intended recipients; it may not be reproduced or disseminated, in whole or in part, without the prior written consent of EAM.
No funds or investment services described herein are offered or will be sold in any jurisdiction in which such an offer or sale would be unlawful under the laws of such jurisdiction. No such fund or service is offered or will be sold in any jurisdiction in which registration, licensing, qualification, filing or notification would be required unless such registration, license, qualification, filing, or notification has been affected.
The material contains information regarding the investment approach described herein and is not a complete description of the investment objectives, risks, policies, guidelines or portfolio management and research that supports this investment approach. Any decision to engage the Firm should be based upon a review of the terms of the prospectus, offering documents or investment management agreement, as applicable, and the specific investment objectives, policies and guidelines that apply under the terms of such agreement. There is no guarantee investment objectives will be met. The investment process may change over time. The characteristics set forth are intended as a general illustration of some of the criteria the strategy team considers in selecting securities for client portfolios. Client portfolios are managed according to mutually agreed upon investment guidelines. No investment strategy or risk management techniques can guarantee returns or eliminate risk in any market environment. All information in this communication has been obtained from sources believed to be reliable but cannot be guaranteed. Investment products are not FDIC insured and may lose value.
Investments are subject to market risk, including the loss of principal. Nothing in this material constitutes investment, legal, accounting or tax advice, or a representation that any investment or strategy is suitable or appropriate. The information contained herein does not consider any investor’s investment objectives, particular needs, or financial situation and the investment strategies described may not be suitable for all investors. Individual investment decisions should be discussed with a personal financial advisor.
Any opinions, projections and estimates constitute the judgment of the portfolio managers as of the date of this material, may not align with the Firm’s opinion or trading strategies, and may differ from other research analysts’ opinions and investment outlook. The information herein is subject to change without notice and may be superseded by subsequent market events or for other reasons. EAM assumes no obligation to update the information herein.
References to securities, transactions or holdings should not be considered a recommendation to purchase or sell a particular security and there is no assurance that, as of the date of publication, the securities remain in the portfolio. Additionally, it is noted that the securities or transactions referenced do not represent all of the securities purchased, sold or recommended during the period referenced and there is no guarantee as to the future profitability of the securities identified and discussed herein. As a reminder, investment return and principal value will fluctuate.
The indices cited are, generally, widely accepted benchmarks for investment performance within their relevant regions, sectors or asset classes, and represent non managed investment portfolio. It is not possible to invest directly in an index.
This communication may contain forward-looking statements, which reflect the views of EAM and/or its affiliates. These forward-looking statements can be identified by reference to words such as “believe”, “expect”, “potential”, “continue”, “may”, “will”, “should”, “seek”, “approximately”, “predict”, “intend”, “plan”, “estimate”, “anticipate” or other comparable words. These forward-looking statements or other predications or assumptions are subject to various risks, uncertainties, and assumptions. Accordingly, there are or will be important factors that could cause actual outcomes or results to differ materially from those indicated in these statements. Should any assumptions underlying the forward-looking statements contained herein prove to be incorrect, the actual outcome or results may differ materially from outcomes or results projected in these statements. EAM does not undertake any obligation to update or review any forward-looking statement, whether as a result of new information, future developments or otherwise, except as required by applicable law or regulation.
Past performance is no guarantee of future results.
20240515-3568076